In EQuIS Professional, the data grid offers several options for viewing and exporting data in EQuIS tables or grid reports.
Options
|
Enable filtering in columns. Click the Filter button |
|---|---|
|
Pin specific columns for easy data review when scrolling back and forth. |
|
Choose columns to hide or unhide. |
|
Select a font size using the drop-down menu to temporarily change the grid display. |
|
Search for information in rows and columns of tables using the Find and Replace Dialog. Click the Find icon in the toolbar or use shortcut Ctrl+F or Ctrl+H. |
|
Refresh tables to display recent changes. |
|
Save changes made to a table. |
Note: Save is not an option in Views in EQuIS Professional. A View contains methods to review data, not to modify data. |
|
Change the appearance of column headers and rows. |
|
Toggle Notes Column, not available in Views. |
|
Toggle Add New Box, not available in Views. |
|
Cascade Delete, not available in Views. Deletes selected row(s) and all child rows in the database. |
|
Finds all child records in the database, not available in Views. |
|
Export table contents to Excel. |
|
Exports (see following section) |
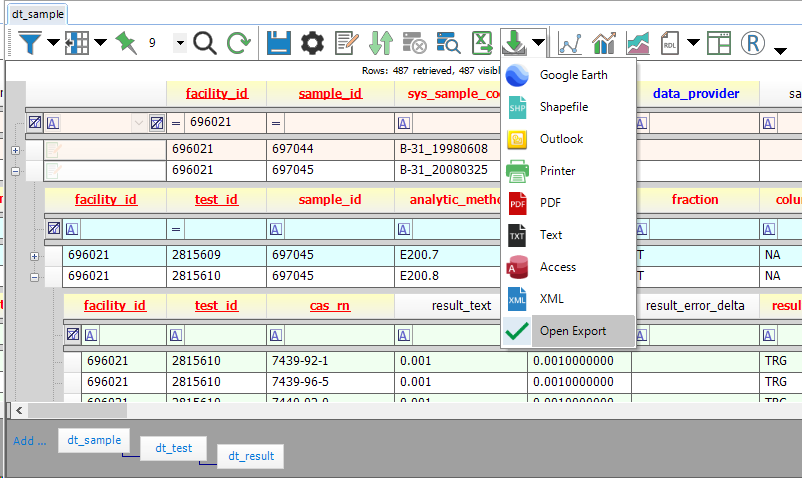
Exports
The ![]() button next to the Export to Excel button opens the Exports dropdown menu.
button next to the Export to Excel button opens the Exports dropdown menu.
|
Display in Google Earth (requires X_COORD and Y_COORD as row headers). |
|
Export as a Shapefile. |
|
Export as an *.xls attachment in an Outlook message. |
|
Send to printer. |
|
Export as a .pdf file. |
|
Export as a text (.txt) file.
Save as type options include: •Tab Separated (*.txt) •Comma separated (*.csv) •HTML (*.htm) •JSON Schema/Data (*.json) - This is the concise JSON format typically used in Enterprise widgets that lists the columns once, then lists each row as an array of values. •JSON Table (*.json) - This is a more verbose JSON format that lists each row as an object with properties. •Compressed Data Table (*.cdt) - This is a compressed, binary format (not human-readable). |
|
Export to Access .mdb file. |
|
Export to .xml. Note that if you are exporting to XML for the purpose of importing through EDP to an EQuIS database, review this Known Issue forum post. |
|
Open Export (deselecting this option prevents exports from opening, once created). |
Other Report Output
|
Create an XY Chart. |
|---|---|
|
Create an XYZ Chart. |
|
Create a Trend Chart. |
|
Create a RDL Report. |
|
Create a Crosstab Report. |
|
Launch and export to RStudio. |